


Which tool to measure your operational performance?
This question is systematically asked by teams and organizations wishing to measure and analyze their operational performance in a global digital environment offering a lot of solutions.
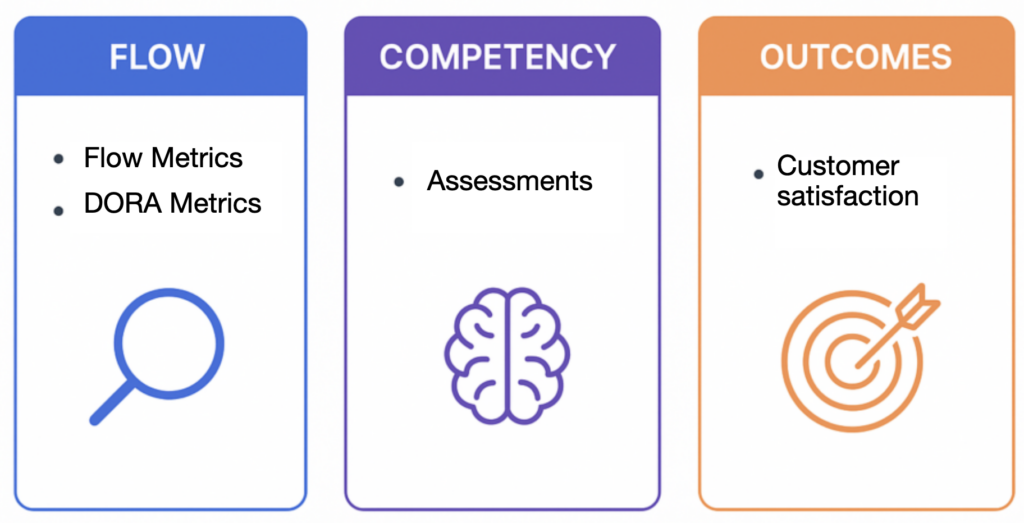
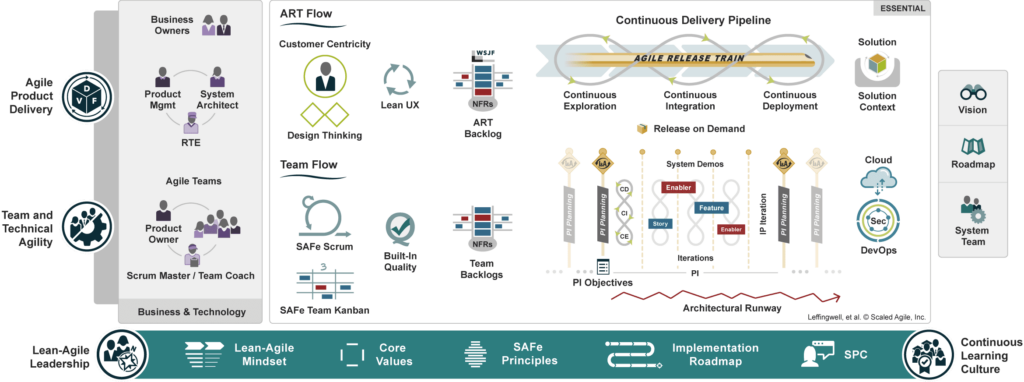
There are three main families of metrics: FLOW; COMPETENCY; and OUTCOMES, which support Business Agility and are perfectly described by the SAFe Framework, part of ScaledAgile.
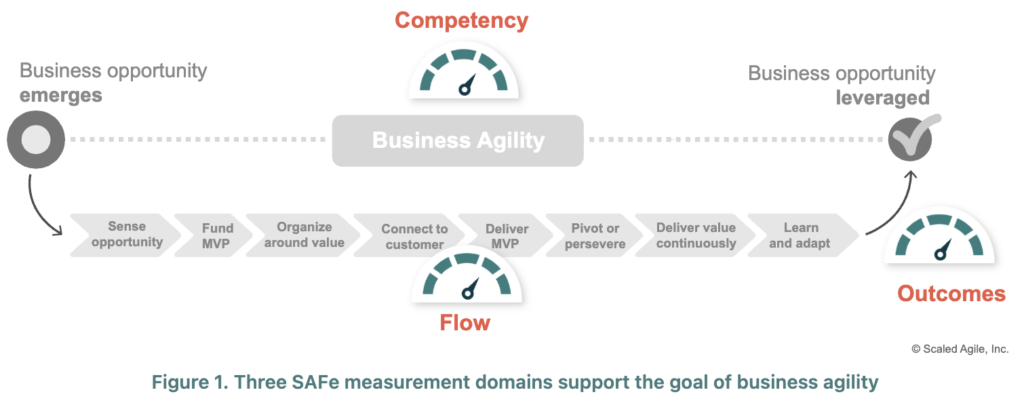
- FLOW: What you deliver, at what pace, and with what quality
- COMPETENCY: How you work, how your teams are doing
- OUTCOMES: The real impact on the client or the business
Most tools on the market focus on a single dimension. Flow Analytics Pro goes further: it allows you to manage the first two pillars – FLOW and COMPETENCY – automatically and intelligently, with the help of Alice, our AI.
FLOW
Flow Metrics
Flow Metrics provides a set of metrics for analyzing the quality of a Team’s (Team Flow) or Program’s (ART Flow) value creation flow.
They help understand how work flows through a system, from initial need to production, and provide all the information needed to continuously improve it.
Popularized by the Flow Framework™, these metrics are particularly relevant in scaled agile environments (such as SAFe), where multiple teams must deliver in a coordinated and continuous manner, but also in teams using other frameworks, such as Kanban or Scrum, to name just the most popular.
Flow Time
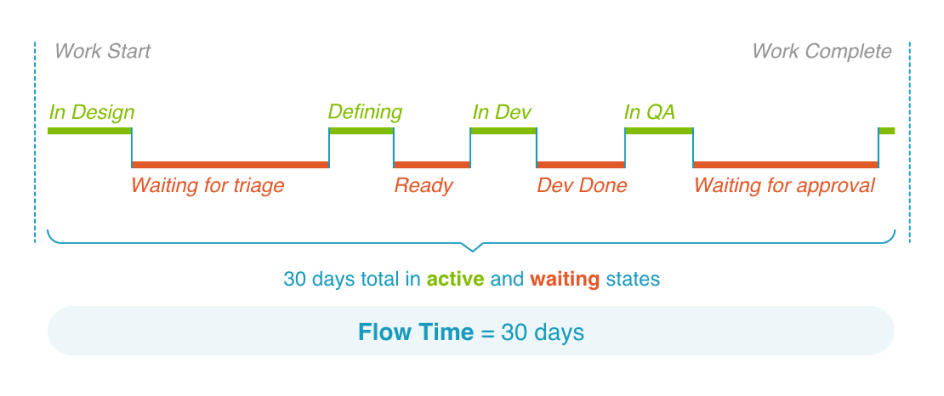
Flow Time Histogram – Represents the distribution of ticket durations (or flow times) over an interval, represented by a start and end stage of the Flow to be analyzed.
Flow Time Scatterplot – Allows you to track tickets processed in a system or process over a given interval. It visualizes each ticket based on when it reached the final stage of the process and the time it took to complete that specific interval.
Flow Time Evolution – This is a feature offered by Flow Analytics Pro. It allows you to visualize the distribution of ticket processing times on a monthly basis, using quartiles to statistically represent flow times (cycle times).
Flow Time Breakdown – Allows you to track the average and median time spent by tickets at each stage of a workflow, as well as compare these times by ticket type.
Flow Distribution
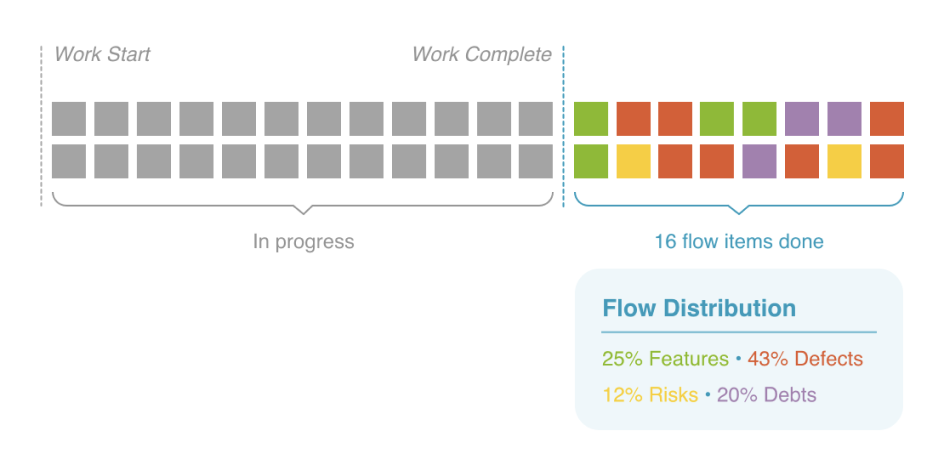
Throughput Run Chart – A performance monitoring tool that visualizes throughput over a period of time and by periodic cycle (daily, weekly, 2 weeks, 3 weeks, monthly, yearly).
Throughput Histogram – A visualization tool commonly used to represent the distribution of throughput in a given flow. Simply put, it shows how throughput values are distributed over a period of time and helps understand the system’s performance or behavior in terms of throughput.
Flow Load (Aging)
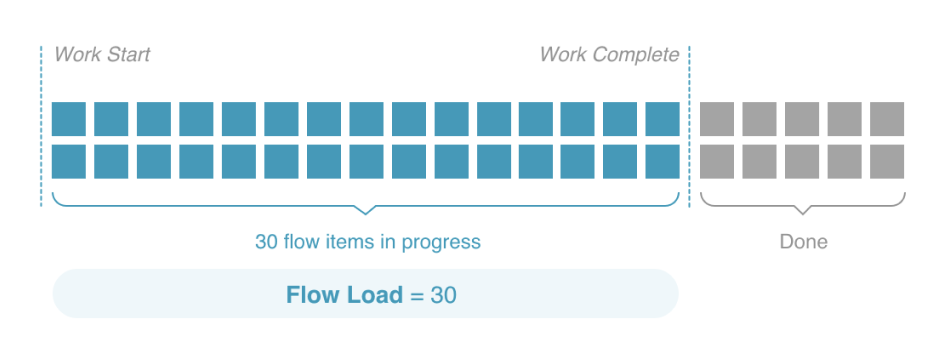
Allows you to track how long tickets have been in the various ongoing (in-progress) stages of the workflow. This graph helps users visualize the age of tickets currently being processed at each stage, to identify bottlenecks or stuck tickets.
Flow Efficiency
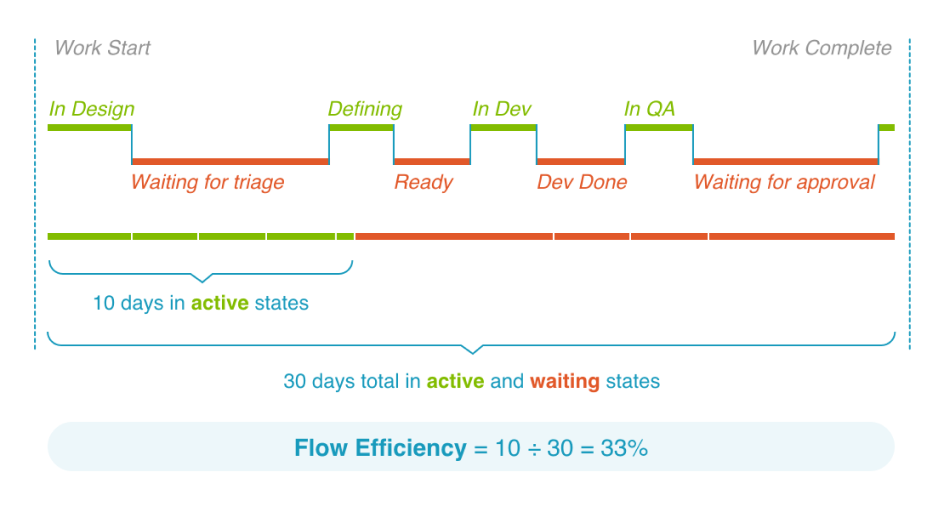
Allows you to measure and visualize the efficiency rate of tickets processed in the flow, i.e. the percentage of time tickets are actually being processed (productive time) compared to the total time they spend in the flow (total time). It indicates how efficient the flow is in avoiding waiting or blocking times.
Flow Velocity
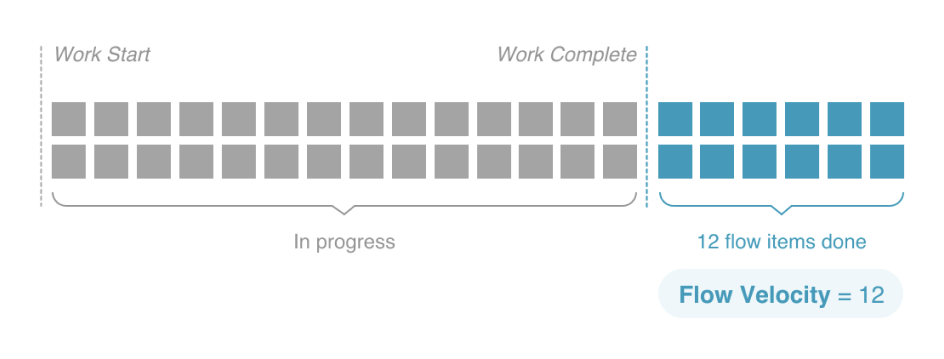
Flow Velocity – Measures the number of work items (features, bugs, tech tasks, etc.) delivered over a given period. It helps assess teams’ delivery capacity and track their productivity over time.
Monte Carlo simulation (Forecast)
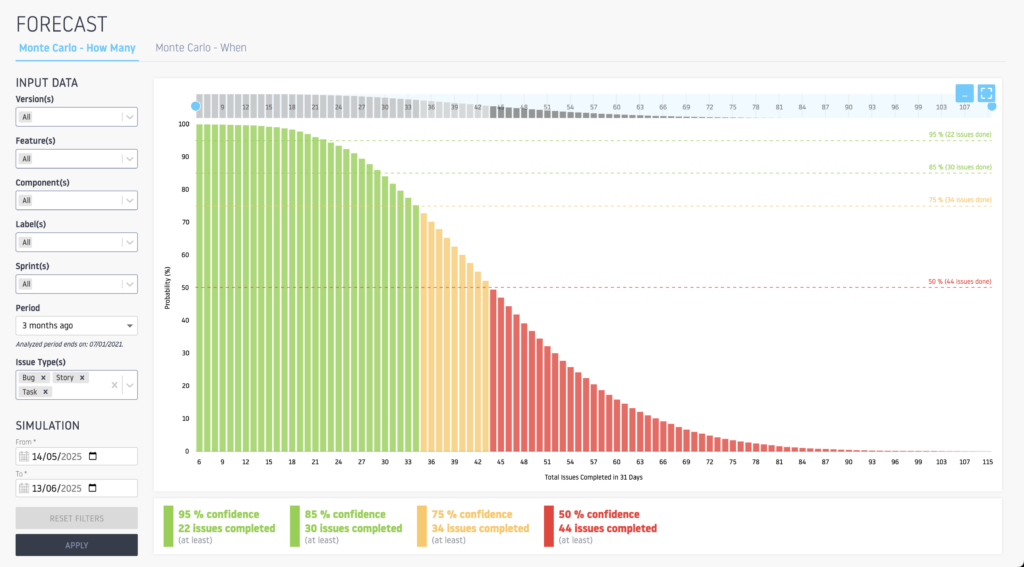
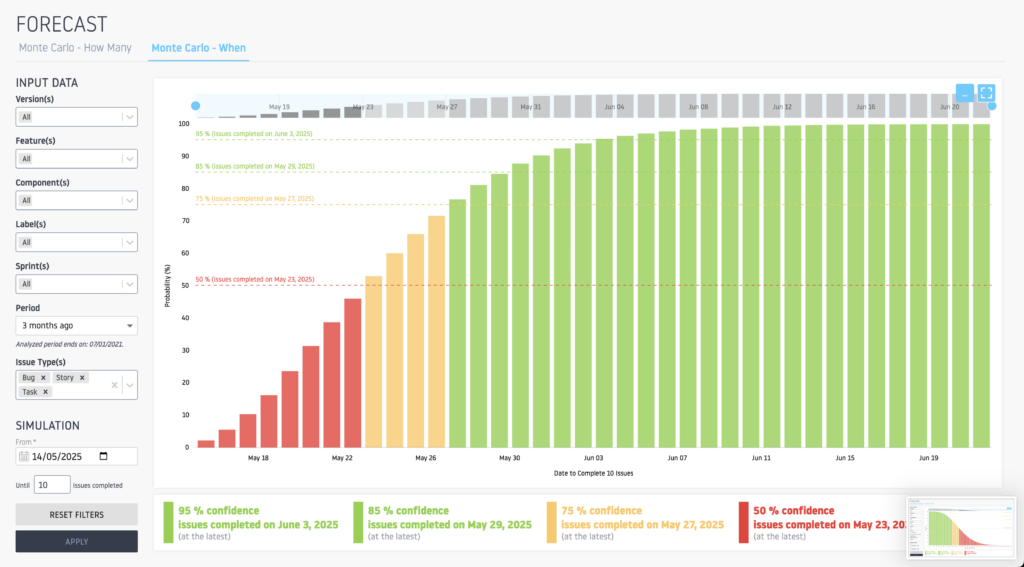
Monte Carlo simulation allows you to run simulations on the probability of delivering a certain number of requests on a given date, as well as on the number of requests that can be fulfilled over a given period.
Since Monte Carlo simulation is based on historical data, it is essential for an organization to ensure that its historical data is clean and that the implemented development value creation process is operational and respected.
Flow Analytics Pro provides organizations with the power of Monte Carlo simulation, on the How Many (how many requests will be delivered over a given period) and When (on what date will a certain number of requests be delivered).
Monte Carlo simulation is implemented on the various dashboards offered by Flow Analytics Pro: Product; Features; Labels; Releases (Increments); and Components.
It is also available via a dedicated section, allowing you to run various simulations.
DORA Metrics
DORA Metrics are specifically designed to assess the performance of DevOps practices.
They focus on four key performance indicators that are essential for understanding and improving a team’s software delivery capabilities. These metrics are:
Deployment Frequency (DF) – measures how often the organization deploys code to production.
Change Lead Time (LT) – the time it takes to go from commit to production.
Mean Time to Restore (MTTR) – the time it takes to restore a service after a failure or issue.
Change Failure Rate (CFR) – the percentage of deployments that result in a failure in production.

Flow Metrics & DORA Metrics – The essential combination
Although Flow Metrics and DORA Metrics serve different aspects of the software development process, they are deeply complementary.
Together, they provide a comprehensive view of team performance, from the efficiency of the development process to the reliability and quality of production deployment.
Flow Metrics can help identify upstream issues that affect DORA Metrics performance, while DORA Metrics can highlight the results of improvements made through the analysis and optimization of deployment and recovery practices, thus enriching the team’s overall ability to respond effectively and maintain operational stability.
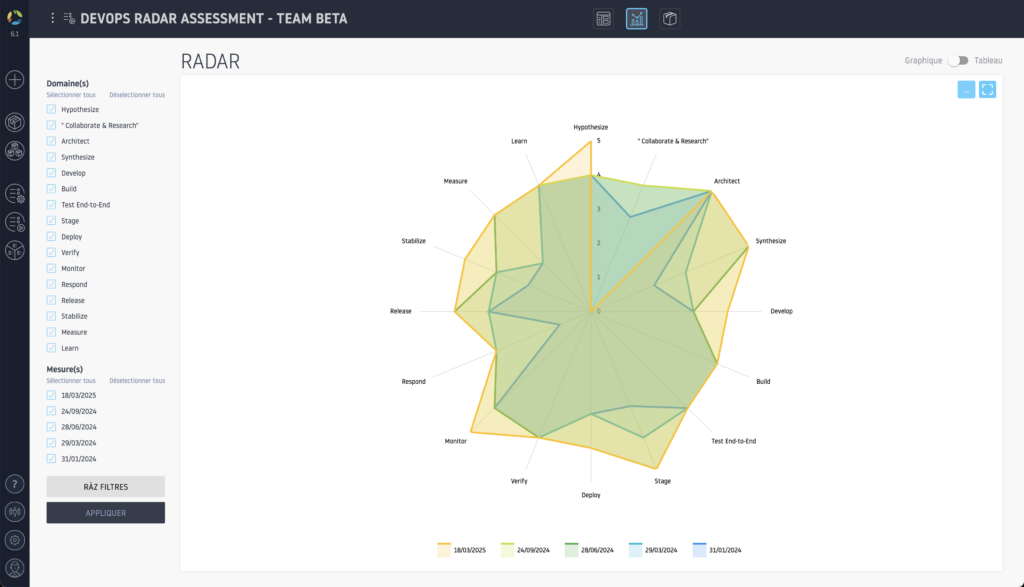
Competency
The Competency section allows you to implement assessments of maturity, functional skills, technical skills, and the health of teams and organizations.
These are essential “human KPIs.” They enable the establishment of a continuous improvement loop for practices, based on the women and men who drive transformation on a daily basis.
Flow Analytics Pro was designed to integrate assessments as an essential component of performance management.
Customize the frameworks according to your contexts (Scrum, Kanban, SAFe, DORA Capabilities, Health Check Maturity, etc.).
Create your own assessment grid!
Assessments can be conducted at the team level and consolidated across multiple teams, for the same skills grid.
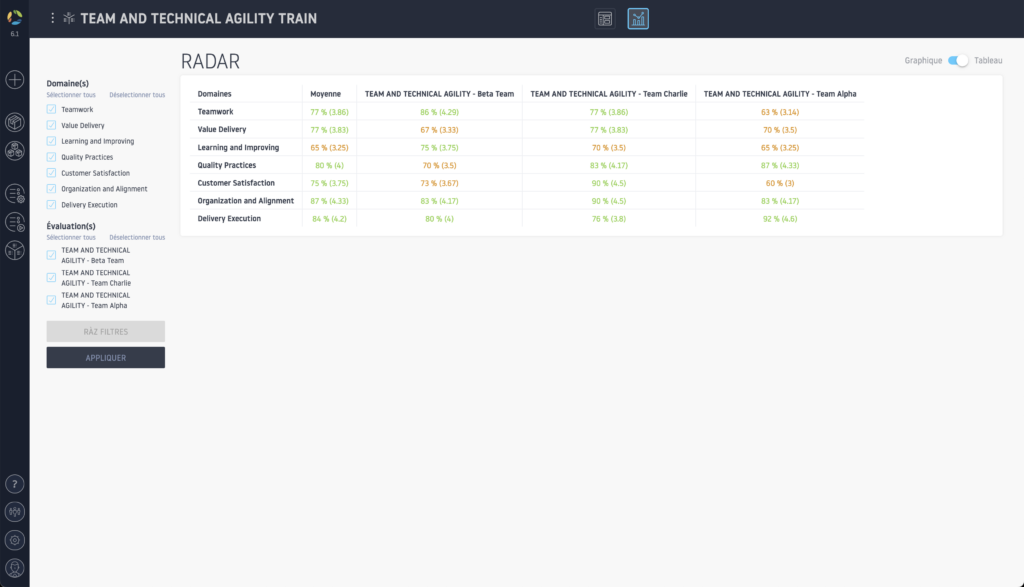
Team Flow & ART Flow
Flow Analytics Pro allows you to measure Flow Metrics, DORA Metrics and Assessments, both at the team level (Team Flow) and at the program level (ART Flow).
Alice – the artificial intelligence that helps you understand your metrics
Measuring isn’t enough! You need to be able to analyze, understand, and act quickly.
This is where Alice, the AI integrated into Flow Analytics Pro, comes in.
Alice is already capable of analyzing Flow Metrics and suggesting areas for improvement:
- Detect anomalies and bottlenecks in your processes,
- Identify positive or negative trends based on previous cycles,
- Recommend actions to reduce cycle times and improve efficiency.
Coming soon for DORA Metrics and Assessments
Alice is constantly evolving. Soon, it will also be able to analyze:
- DORA Metrics (via GitHub and GitLab) – to evaluate the performance of CI/CD pipelines,
- Assessment results – to detect gaps between team perceptions and actual metrics, and identify priority projects.
And the OUTCOMES?
Business results (customer satisfaction, revenue, product adoption, etc.) are not generated by a delivery tool. Instead, they depend directly on your internal flow and skills.
Our goal is clear: to help you create the conditions to achieve your results.
By focusing on FLOW and COMPETENCY, you build a sustainable foundation for your OUTCOMES.
Conclusion
Choosing the right tool to transform your organization’s operational performance is essential.
In an increasingly volatile and uncertain economic and social environment, having the right metrics is essential. Tools capable of capturing both the quality of the value stream (FLOW – Flow Metrics & DORA Metrics) and team maturity (COMPETENCY) will enable you to move from reactive to proactive management.
Whether you’re managing a team (Team Flow) or a program (ART Flow), you need reliable data to detect bottlenecks, optimize processes, and strengthen team cohesion. By combining Flow Metrics (Team Flow, ART Flow), DORA Metrics, and customized Assessments, you can maximize the impact of your transformation.
Flow Analytics Pro meets these organizational objectives and addresses both dimensions, giving your teams the tools to continuously improve, collaborate more effectively, and deliver faster without compromising quality.
Don’t choose a simple dashboard. Choose a real operational performance lever.