


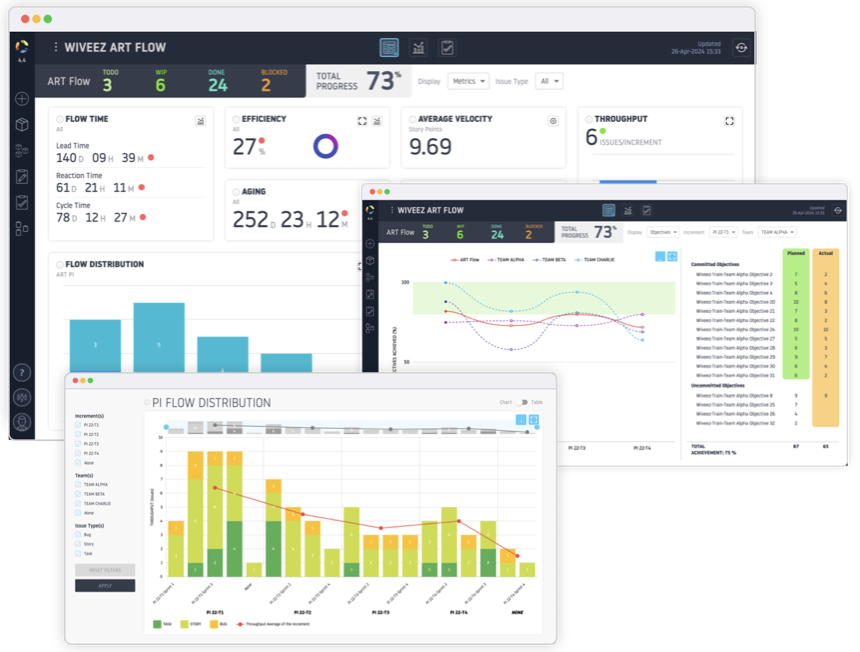
Achieve successful large-scale Agile deployment with our program-level (multi-team) metrics and
our complete range of flow performance monitoring
Whether you want to implement Agile at scale with SAFe (Scaled Agile Framework), a Feature Team organization, or any other framework.
Flow Analytics Pro helps you transform your culture and teams.
DASHBOARD
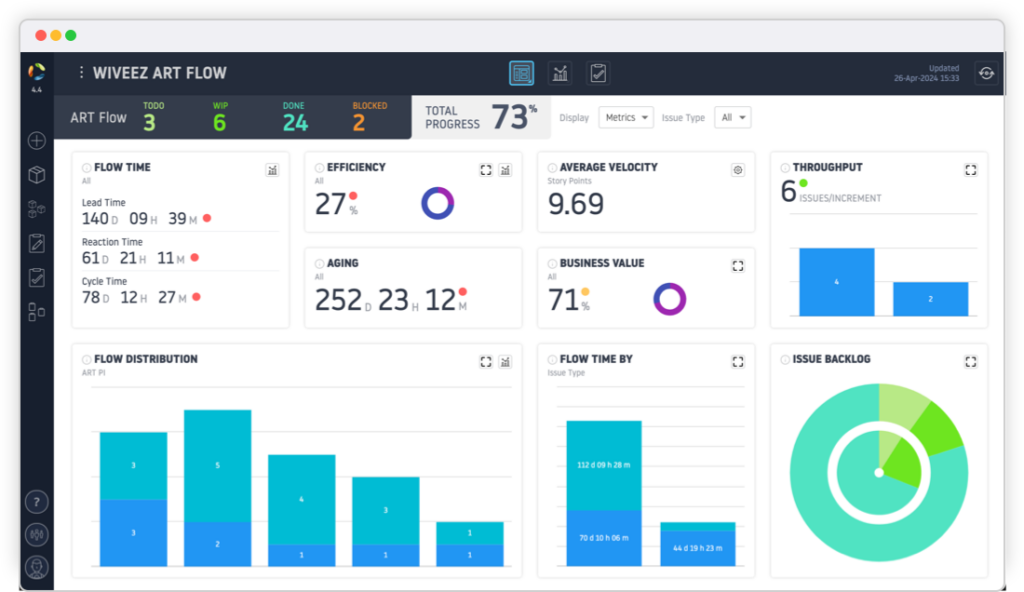


ART FLOW DASHBOARD
Allows you to monitor the performance indicators of the Flow, at the program level:
- Distribution of request flow;
- Aging of requests; Average velocity Multi-team Scrum;
- Business value generated;
- Average throughput/increment by request type;
- Track tickets by priority;
- Monitoring the distribution flow of program level requests (Feature, …) by increment;
- Monitoring of Flow Time, by type of program level request (Feature, etc.).
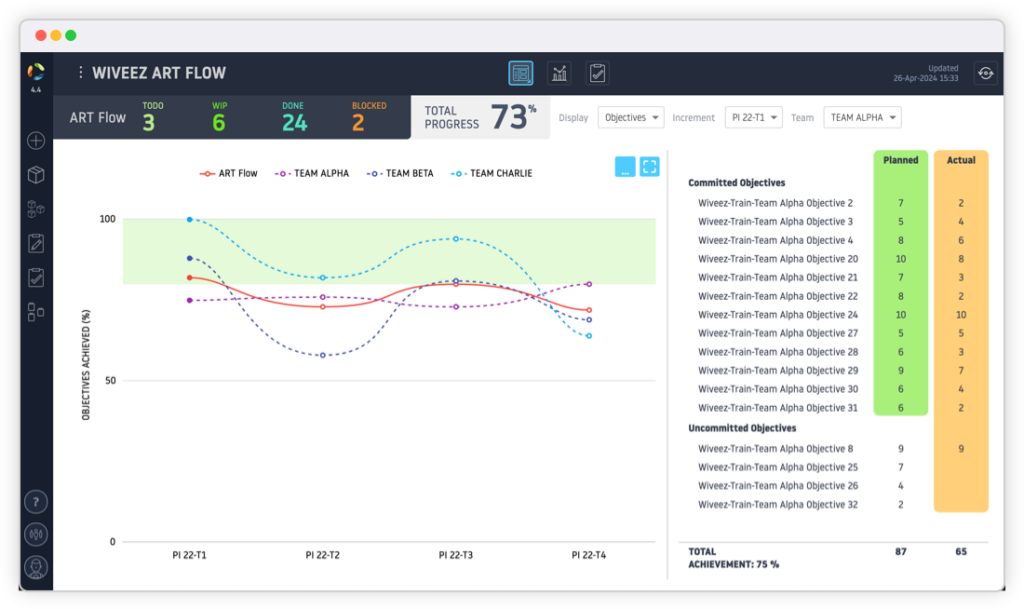
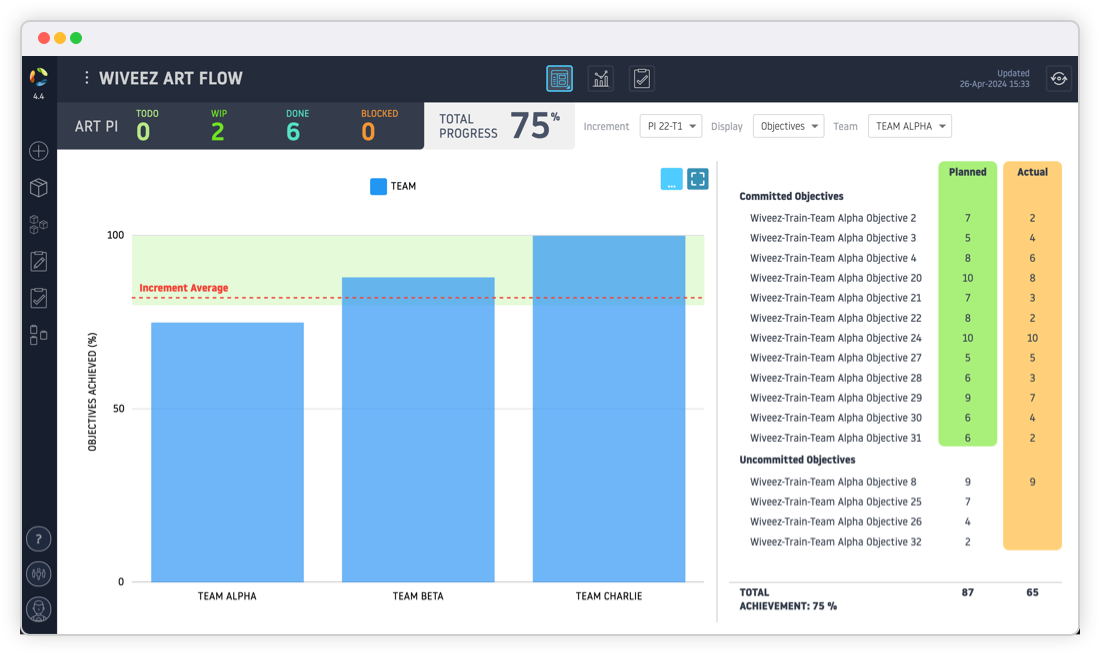
ART FLOW OBJECTIVES
Allows you to monitor the achievement of ART FLOW Objectives, by Increment and by Team.
Monitoring the Objectives makes it possible to identify whether the expectations of the business in terms of value generated on the Product are achieved and thus define the capacity of the program to meet its business commitments.
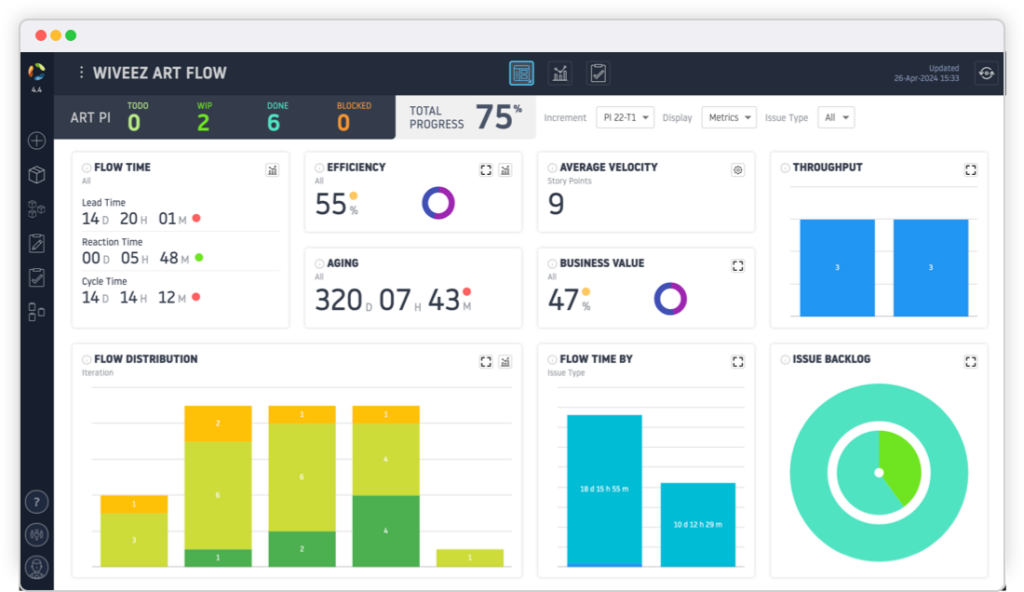
ART PI DASHBOARD
Allows you to monitor the performance indicators of the Flow, at the level of a Program Increment:
- Program ticket flow, by request type;
- Aging of requests; Average velocity Multi-team Scrum;
- Business value generated;
- Average throughput/increment by request type;
- Tracking requests by priority;
- Monitoring the distribution flow of program level requests (Feature, …) by increment;
- Monitoring of Flow Time, by type of program level request (Feature, etc.).
ART PI OBJECTIVES
Allows you to monitor the achievement of the objectives of an Increment of the program, by Iteration and by Team
Monitoring the Objectives makes it possible to identify whether the business expectations in terms of value generated on the Product are achieved and thus define the capacity of each Increment to meet its business commitments.
ART FLOW CHARTS
Flow Analytics Pro provides you with a set of graphs for monitoring and analyzing the performance of the value flow of your ART FLOW.
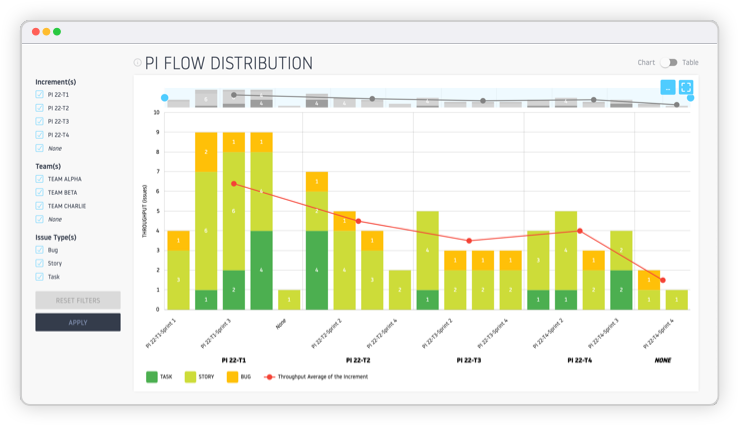
Distribution Flow by Increment
Analyze the distribution of your requests, by Increment and by Iteration.
This graph makes it possible to analyze the variation in the processing of consolidated requests across all program teams.
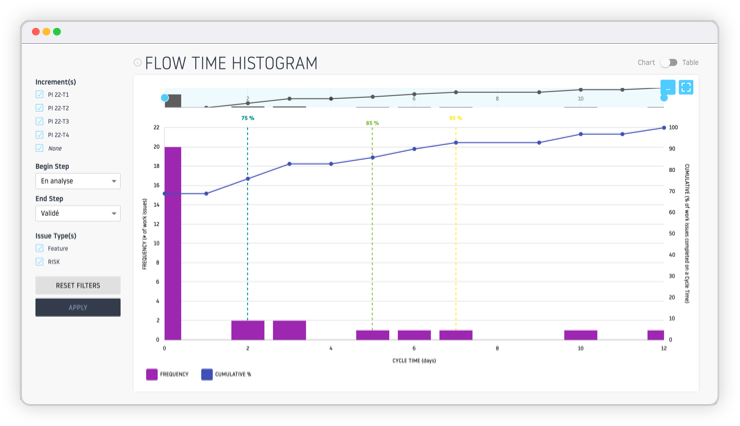
Flow Time Histogram
Represents the distribution of time required to complete the work items in your ART Flow.
This type of visualization helps detect deviations from expected performance standards and target improvements to reduce delays and optimize processes.
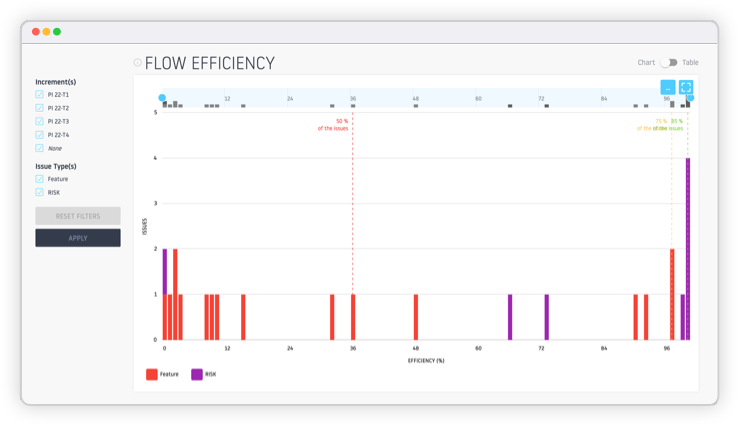
Flow Efficiency
Analyze the relationship between active time working on a task and total flow time, from start to completion of the task.
This metric allows you to evaluate the efficiency with which time is used in the process, distinguishing between productive time and waiting or inactivity time.
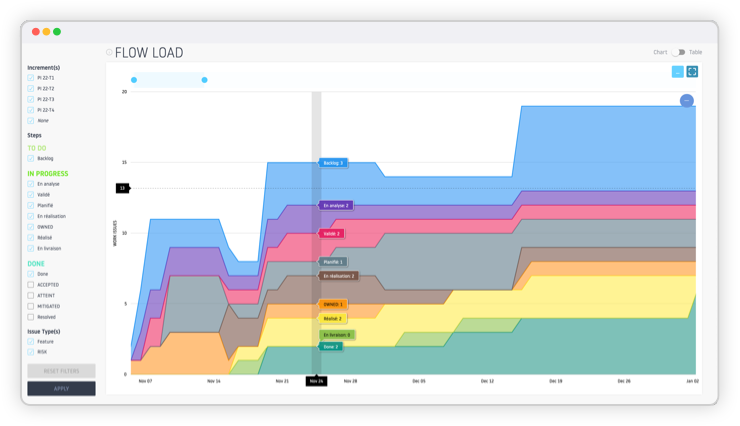
Cumulative Flow Diagram (CFD)
Visually represents the amount of work in different stages of a process, over a given period of time.
CFD helps identify bottlenecks, assess process capacity, and adjust workload to maintain consistent and efficient flow.
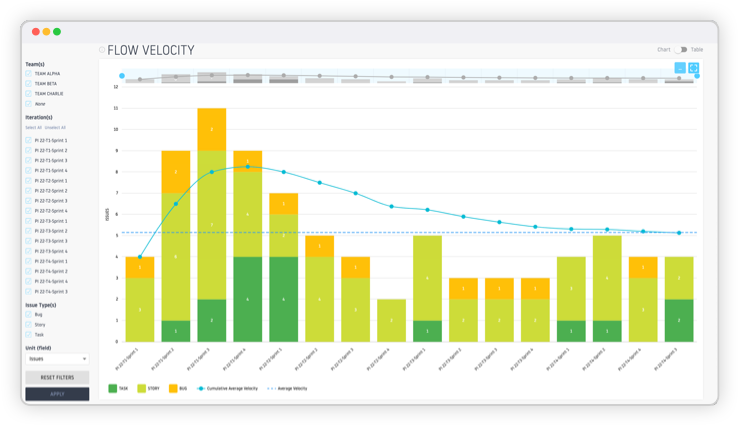
Flow Velocity
Monitor and analyze the velocity generated on iterations of the program, consolidated across all teams.
This graph allows you to analyze the performance and predictability of teams.
Flow Analytics Pro provides you with filters to accurately analyze the performance of your program.
Flow Analytics Pro provides real-time insights into agile metrics, allowing us to identify areas for improvement. With the addition of Alice, the AI included in Flow Analytics Pro that analyzes these metrics, the process becomes more automated, enabling the agile coach to focus on value-driven actions rather than manually analyzing charts to detect issues or workflow anomalies within the team.
Flow Analytics Pro empowers teams to independently assess their progress, increases transparency regarding team health, and enables decision-making based on experience rather than estimation.
ANTOINE COMBLE
Facilitator, Agilist, Serious Games Creator at Zenika
Flow Analytics Pro has given us an in-depth view of our Agile Metrics […] while helping us identify different levers for improvement.
GUILLAUME BERTRAND
ScrumMaster Leader
SNCF Connect
Flow Analytics Pro is an essential tool for Agile teams, combining refined usability and powerful analytics.
Stéphane Métivier
Complementing JIRA, it offers a clear and intuitive visualization of work, allowing you to detect bottlenecks, optimize workflows, and reduce deadlines thanks to key indicators such as cycle time and lead time.
The integration of Alice AI enriches the experience with relevant recommendations. Easy to use, Flow Analytics Pro integrates seamlessly into existing practices and produces concrete results in the first few weeks.
Finally, the Flow Analytics Pro team is attentive and responsive to our needs.
Agile Coach
U TECH
The introduction of Flow Analytics Pro at JCDecaux, driven by the DSI Corp. and with my support as Head of Agile Lab, has standardized our practices and strengthened the measurement of agile indicators for all teams within the Group DSI. This has optimized our workflows and promoted a culture of transparency, collaboration, and continuous improvement, essential to our constant quest for operational excellence across all our information systems.
Vanessa Lhomme
Head of Agile Lab
DSI Corp. JCDecaux
Within the Air France-KLM Group, more than 250 agile projects and Product Teams are now using Flow Analytics Pro. Since its implementation, our teams have continuously enhanced their agile practices, across all areas of agility. They are actively using & sharing measurable results and strengthening their relationships with the business units. This tool is a “must have” for companies committed to supporting their teams in the continuous improvement of their delivery processes
Tristan Breton
Steering & Transformation
Air France-KLM